


It is not just equity that IFAs, banks and NDs prefer selling. The latest MFDEx data, which covers 96% of the industry shows that these distributors account for 35% of the total gross sales in debt funds.
Of the Rs.1.53 lakh crore of gross inflows in debt funds between April and June 2018, distributors, banks and NDs have added Rs. 53,543 crore. These numbers are encouraging as majority inflows in debt funds come from institutional investors who invest through the direct route.
Further, out of the Rs. 53,543 crore, majority of the money has come through online distributors (Rs. 18,982 crore), IFAs (Rs. 11,475 crore) and NDs (Rs. 11,473 crore).
If we look at geographical distribution of assets, distributor driven flows in debt funds was higher in B30 cities compared to T30 cities due to the large number of institutional investors in T30 cities. Overall, 65% of debt sales in B30 locations has come from regular plans compared to 32% share in T30 cities.
Online and overseas distributors have contributed 26% of gross inflows in debt funds in B30 cities (Rs. 3,192 crore) and 11% in T30 cities (Rs. 15,790 crore). IFAs followed online and overseas distributors with 24% contribution in B30 locations (Rs. 2,943 crore) and 6% in T30 cities (Rs. 8,532 crore).
National distributors have 8% share with Rs.10,961 in T30 cities last quarter. In B30 cities, their presence is miniscule with just Rs. 512 crore of sales in debt funds (4% share in gross sales).
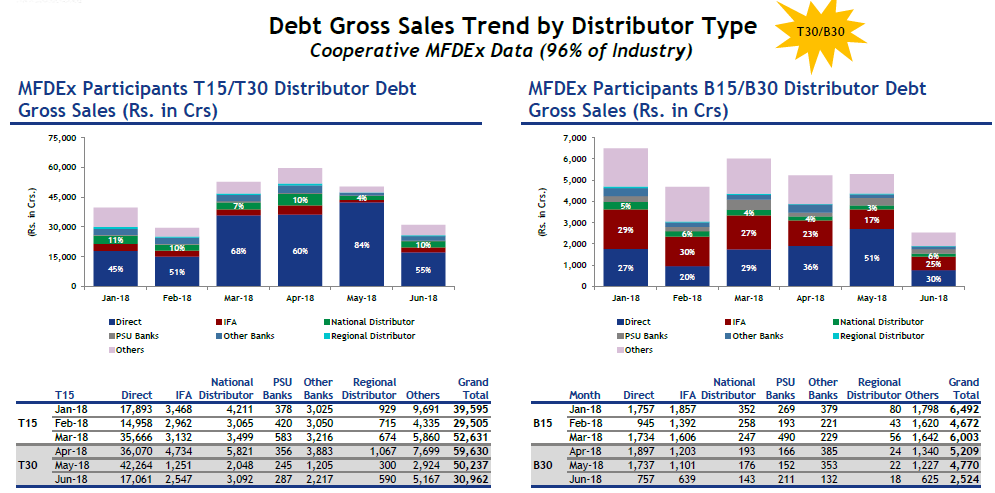
Direct plans have accounted for 68% of the T30 inflows and 35% of B30 flows in debt funds. Overall T30 cities have seen gross sales of Rs. 95,395 crore through direct route during the quarter while B30 cities recorded Rs. 4,391 crore of sales.
Overall, gross inflows in debt funds have decreased in the last few months. From Rs. 64,839 crore in April, the flows have reduced to Rs. 33,486 crore in June 2018. Majority of these outflows are due to withdrawal from institutional investors. We see this reflected in 53% decrease in overall direct plan sales between April 2018 (Rs. 37,967crore) to June 2018 (Rs. 17,818 crore).
Overall, sales flows in debt have reduced across distributor categories.
Debt Gross Sales Trend (Rs. Crore)
|
|
Month |
Direct |
IFA |
National Distributor |
PSU Banks |
Other Banks |
Regional Distributor |
Others |
Grand Total |
|
T 30 |
Apr-18 |
36,070 |
4,734 |
5,821 |
356 |
3,883 |
1,067 |
7,699 |
59,630 |
|
May-18 |
42,264 |
1,251 |
2,048 |
245 |
1,205 |
300 |
2,924 |
50,237 |
|
|
Jun-18 |
17,061 |
2,547 |
3,092 |
287 |
2,217 |
590 |
5,167 |
30,962 |
|
|
Change from April 2018 |
-53% |
-46% |
-47% |
-19% |
-43% |
-45% |
-33% |
-48% |
Source: MFDEx
|
|
Month |
Direct |
IFA |
National Distributor |
PSU Banks |
Other Banks |
Regional Distributor |
Others |
Grand Total |
|
B 30 |
Apr-18 |
1,897 |
1,203 |
193 |
166 |
385 |
24 |
1,340 |
5,209 |
|
May-18 |
1,737 |
1,101 |
176 |
152 |
353 |
22 |
1,227 |
4,770 |
|
|
Jun-18 |
757 |
639 |
143 |
211 |
132 |
18 |
625 |
2,524 |
|
|
Change from April 2018 |
-60% |
-47% |
-26% |
27% |
-66% |
-25% |
-53% |
-52% |
Source: MFDEx