


One of the most popular (and probably an ice breaker) question I get as an investment manager is – What’s your take on market or “market kya lagta hai?” I have always answered it in two parts - my view on macro economy and market valuation. Since macro is not the discussion topic of this article, we shall focus on the second factor – market valuation.
Typically, the answer to market valuation is guided by where was the index price earnings (PE) multiple in relation to its historical average. If current market PE is higher than historical average, market was supposed to be expensive and vice-versa.
Nifty 50 Index current trailing twelve month (ttm) PE is at 26.2x, which is at 49% premium to its 18-year average based on data provided by Bloomberg. Even excluding loss-making companies, Nifty trades at a ttm PE multiple of 22.4x, which is at a 30% premium to its 18-year average. Thus, based on the current ttm PE multiples, markets appear expensive, right? We argue otherwise.
We have identified the fallacy of using the index PE multiple as a benchmark for valuation.
Remember, the index providers are accurate in the way they calculate the index Earnings Per Share (EPS) or Price Earnings (PE) multiple. What we are highlighting in this article is the fallacy in its interpretation as a fair valuation benchmark by investors.
Arithmetic of index numbers
So let’s start by constructing a hypothetical index which has just two constituents: 1) a bank which normally trades at 10x P/E, and 2) an FMCG company, which normally trades at 50x P/E. The index earnings shall be aggregate profits of both companies. The index market capitalisation shall be aggregate market capitalisation of both companies.
Case 1: Index is expensive
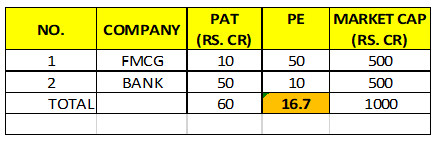
In base period, FMCG company has a net profit of Rs.10 crore and the bank has net profit of Rs.50 crore
Our index looks as follows in base period:
Base period
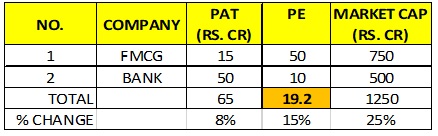
One year later, assume the FMCG company’s profits grow at 50% and bank’s profits stay flat. Then our Index would look as follows in the one-year forward period:
One-Year Forward Period
Now, carefully note the changes in the index parameters.
- The index earnings have grown at 8%, while the Index has delivered a 25% return
- Its PE multiple has increased from 16.7x in base period to 19.2x in one-year forward period
Case 2: Index is cheap
The base period, remains the same - FMCG company has a net profit of Rs.10 crore and the bank has net profit of Rs.50 crore
Base Period
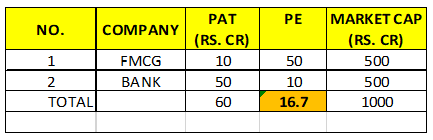
Base period
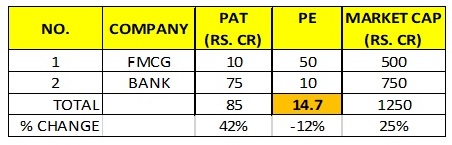
One year later, assume the FMCG company’s profits stay flat, while bank’s profits grow at 50%. Then our Index would look as follows in the one-year forward period:
One-Year Forward Period
Now, carefully note the changes in the index parameters.
- The index earnings have now grown at 42%, while the Index has delivered a 25% return
- Its PE multiple has reduced from 16.7x in base period to 14.7x in one-year forward period
Thus, we can draw the following conclusion from the above hypothetical example:
- If high PE companies are growing earnings at a faster pace than low PE ones, the index earnings growth appears abnormally weak and index PE multiple apparently expands as was the case in case 1
- If low PE companies are growing earnings at a faster pace than high PE ones, the Index earnings growth appears abnormally strong and Index PE multiple apparently contracts, as was the case in case 2
- The reason this anomaly happens is because higher PE companies have a lower weightage in Index earnings compared to their weight in the benchmark and vice versa.
Reason no.2: Sum of the parts (SOTP)
One more error happens when looking at just reported index PE multiples. Some constituent companies may have incubated valuable businesses, which may not be contributing significantly to bottomline but market has already started ascribing value to such businesses future. Such companies may appear expensive based on reported PE multiples. Thus, companies where sum-of-the-parts (SoTP) valuation is important would lead to erroneous conclusions for an analyst analysing the index PE. Within NIFTY50, a company with large index weight has incubated a successful telecom business, which currently contributes little to earnings but significantly to the overall company’s market capitalisation.
Thus, some of the analytical errors, which can be deduced by an analyst from an index PE are:
a) He would conclude that the index has become expensive if the overall earnings growth of high PE companies is greater than low PE ones
b) He would conclude that the index has become cheap if the overall earnings growth of low PE companies is greater than high PE ones
Fair value approach
There is an approach to arrive at a relevant index valuation benchmark, which can serve as a directionally more accurate metric.
Based on this approach, we derive the fair PE multiples of companies, which are driven by four factors:
a) Earnings growth: All other things being equal, higher the sustainable earnings growth, higher would be the fair value multiple and vice versa.
b) Return on Equity: All other things being equal, higher the sustainable return on equity, higher would be the fair value multiple and vice versa.
c) Riskiness of underlying business: Investors would want higher compensation to invest in riskier businesses compared to less risky ones. This compensation manifests itself in the form of lower fair value multiple for riskier business compared to less risky ones.
d) Risk free rate: Just like bonds, equities have an inverse relation with interest rates. Higher the interest rate, lower would be the fair value multiple and vice versa.
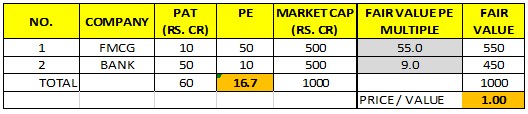
To understand the impact of this approach on valuation comparisons, let’s continue with our earlier hypothetical index, with a few additional assumptions as follows: 1) suppose the FMCG company should command a PE fair value multiple of 55x, and 2) suppose the bank should command a PE fair value multiple of 9x. Thus, when the FMCG company trades at 50x multiple, it is actually cheaper than its fair value. When the bank trades at a 10x multiple, it is expensive than its fair value.
Case 3: Index is undervalued
In base period, FMCG company has a net profit of Rs.10 crore and the bank has net profit of Rs.50 crore. The base period index has a market value of Rs.1000crore, while its fair value is also at Rs.1000 crore. Thus, the index is being fairly valued in base period.
Our Index looks as follows in base period:
Base Period
One year later, assume the FMCG company’s profits grow at 50% and bank’s profits stay flat.
Then our Index would look as follows in the one-year forward period:
One-Year Forward Period
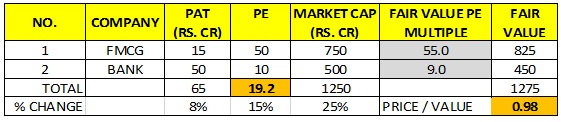
Note the changes in the index parameters.
- While index has increased by 25%, its Fair Value has increased at a faster pace of 27.5%
- Thus index has actually become about 2% cheaper than in based period
- This is consistent with components. Cheaper company grew, while expensive stayed flat. Hence, the blend of both is cheaper
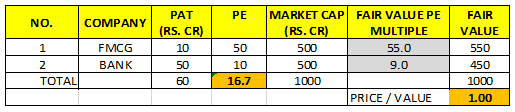
Case 4: Index is overvalued
Assuming the above figures
Our Index looks as follows in base period:
Base Period
One year later, assume the FMCG company’s profits stay flat, while Bank’s profits grow at 50%. Then our Index would look as follows in the one-year forward period:
One-Year Forward Period
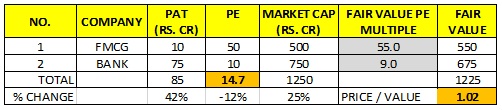
Note the changes in the index parameters.
- While index has increased by 25%, its Fair Value has increased at a slower pace of 22.5%.
- Thus index has actually become about 2% expensive than in based period.
- This is consistent with components. Expensive company grew, while cheap company had no growth. Hence the blend of both is expensive.
Indian market valuation from the lens of fair value approach
Markets have remained broadly efficient and have delivered returns in line with growth in fair values. Following are our findings for the period between March 31, 2012 and March 31, 2019:
a) Adjusted Nifty index delivered a compounded return on 15.8%
b) Nifty Index Fair Value grew at a compounded growth of 14%
c) Nifty Index Earnings grew at a compounded growth of 8.3%.
Conclusion
Investors should not depend on index PE multiples to make judgements about overall market valuations. India’s market over the last seven years appears to have turned expensive based on PE multiples, as companies which deserve to trade at high multiples have delivered superior earnings growth compared to most cyclical companies which deserve to trade at lower multiples.
Hence, fair value approach is the directionally correct and consistent approach to make judgements on market valuation.
Vinay Paharia is CIO of Union AMC. The views expressed in this article are solely of the author and do not necessarily reflect the views of Cafemutual.