


Global and passive investing are two of the most talked about themes in Indian mutual funds today. The US, for its pool of great companies and mature markets, remains a favourite with Indian investors. In fact, many fund houses have been launching newer passive fund strategies for investors with different goals and risk appetites.
Currently, US-based passive funds in India track four US indices: the S&P 500 (Motilal Oswal S&P 500 Index Fund); Nasdaq 100 (Motilal Oswal Nasdaq 100 FoF, Kotak Nasdaq 100 FoF); NYSE FANG+ (Mirae Asset NYSE FANG+ ETF & FoF) and the S&P 500 Top 50 (Mirae Asset S&P 500 Top 50 ETF & FoF).
We evaluate the four indices to understand each strategy and its suitability for different investors.
Strategy comparison of the four US indices
The S&P 500 index is a broad-based index tracking 500 large companies selected by a governing committee based on factors like market capitalisation, liquidity and financial viability. The S&P 500 Top 50 index is a more focused take on the broader index and is made up of the largest 50 (mega and large cap) stocks from the S&P 500.
The Nasdaq 100 index comprises the 100 largest non-financial companies in the US whereas the NYSE FANG+ index comprises 10 highly-traded growth stocks across the technology and consumer discretionary sectors.
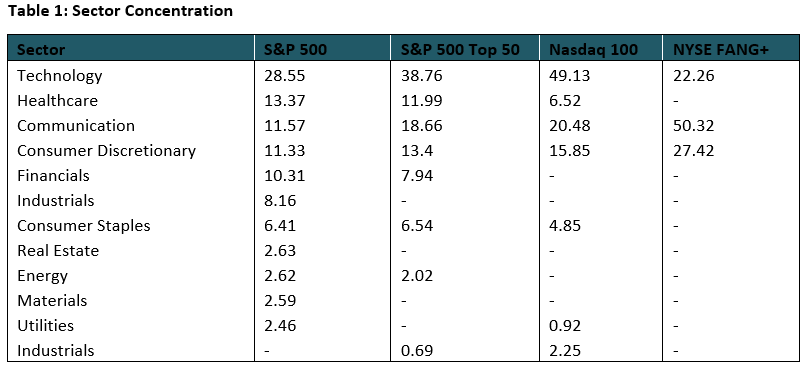
Of the four indices, the S&P 500 index offers well-diversified exposure covering approximately 80% of US market capitalisation.
In comparison, the other three take more concentrated bets based on sector, theme or capitalisation. In terms of number of stocks, the S&P 500 is again the most diversified of the lot, whereas the NYSE FANG+ is the most concentrated.
Approximate figures as on August 31, 2021
Source: Bloomberg, iFAST Research
Table 2: Stock Concentration
|
Index |
No. Of Stocks |
|
S&P 500 |
500 |
|
S&P 500 Top 50 |
50 |
|
Nasdaq 100 |
100 |
|
NYSE FANG+ |
10 |
Source: iFAST Research
Performance & valuation
In the past decade, NYSE FANG+ and Nasdaq 100 have been leading the other indices in terms of performance with accelerated digitalisation and low fixed income yields aiding the re-rating of tech stocks. Owing to its focus on mega and large cap stocks, the S&P 500 Top 50 index has had a slight edge over the S&P 500 in most years.
Table 3: Calendar Year Returns (Absolute - USD Terms) (%)
|
Year |
S&P 500 TRI |
S&P 500 Top 50 TRI |
Nasdaq 100 TRI |
NYSE FANG+ TRI |
|
|
(Passive) |
(Passive) |
(Passive) |
(Passive) |
|
2021 YTD* |
21.58 |
22.54 |
21.49 |
16.33 |
|
2020 |
18.40 |
24.46 |
48.88 |
103.09 |
|
2019 |
31.49 |
32.51 |
39.46 |
39.92 |
|
2018 |
-4.38 |
-3.35 |
0.04 |
0.26 |
|
2017 |
21.83 |
23.28 |
32.99 |
58.75 |
|
2016 |
11.96 |
11.29 |
7.27 |
15.91 |
|
2015 |
1.38 |
4.21 |
9.75 |
30.09 |
|
2014 |
13.69 |
12.25 |
19.40 |
- |
|
2013 |
32.39 |
29.09 |
36.92 |
- |
|
2012 |
16.00 |
15.95 |
18.35 |
- |
TRI: Total Return Index
*January 1 - August 31, 2021
**Represents the mother fund of Franklin India Fund
Source: Bloomberg, iFAST Research
In terms of valuation, US indices are currently trading at considerably higher levels than their recent averages. Comparatively though, the S&P 500 index is attractively valued versus the other indices at this time.
Chart 1: Valuations of US Indices
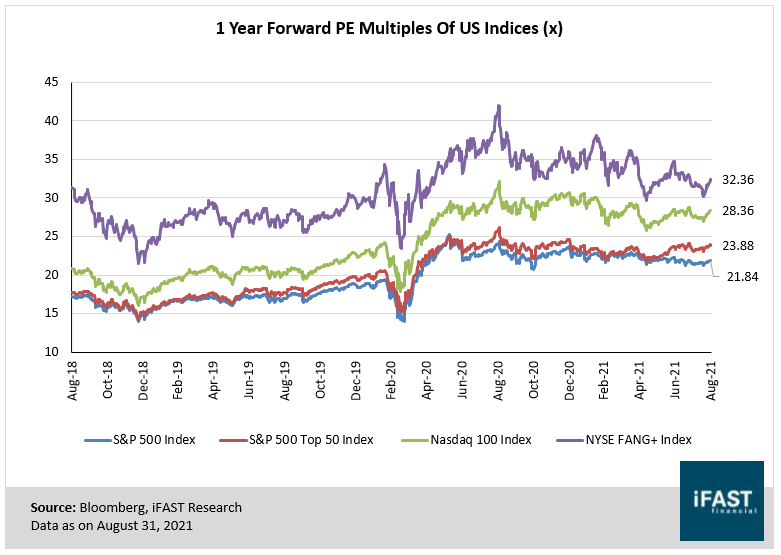
Table 4: Index Valuations
|
Index |
1-Year Forward PE (x)* |
|
|
|
Current |
Long Term Average |
|
S&P 500 |
21.84 |
16.841 |
|
S&P 500 Top 50 |
23.88 |
19.432 |
|
Nasdaq 100 |
28.36 |
19.311 |
|
NYSE FANG + |
32.36 |
31.193 |
*As on August 31, 2021
1For 10 years
2For 4.3 years
3For 3.5 years
Source: Bloomberg, iFAST Research
A shift from defensives towards cyclicals will be good news for S&P 500 and S&P 500 Top 50, with the broader index likely to benefit more. Nasdaq 100 and NYSE FANG+ will be particularly sensitive to changes in rates since tech stocks are valued based on the discounted cash flow methodology.
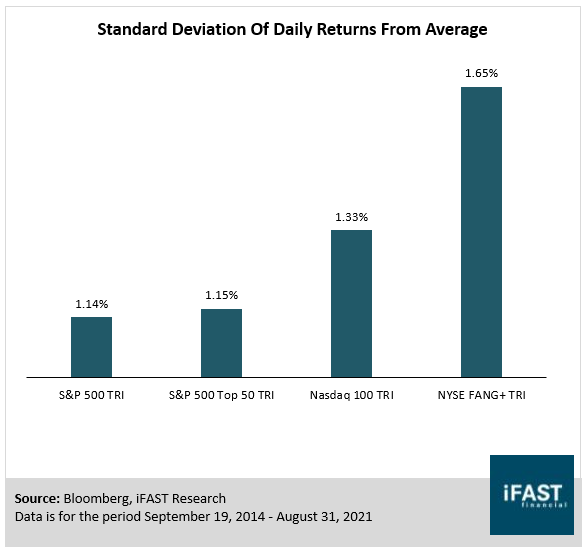
Volatility
Given their high exposure to tech names, NYSE FANG+ and Nasdaq 100 are, as expected, more volatile. S&P 500 and S&P 500 Top 50, despite a significant difference in stock concentration, have seen similar levels of volatility.
Choosing the right passive strategy
In summation, investors can use the following guidelines when choosing a passive strategy for investing in the US.
NYSE FANG+ index is a high risk, high reward proposition. 5-10 percent of an investor’s US exposure can be in this index, complementing exposure to the S&P 500 index. However, this index is not recommended if one has already invested in Nasdaq 100.
Nasdaq 100 entails high concentration risk. Only investors with a high risk appetite and long-term horizon (10 years or longer) should consider investing in this index.
The S&P 500 index is one of the best representatives of the US market and its diversified sectoral nature makes it apt for any risk profile and any time horizon.
S&P 500 Top 50 can be looked at by investors who prefer a focused approach to passive investing in the US, but would like reasonable exposure to non-tech sectors (unlike the Nasdaq 100 and NYSE FANG+ indices).
How to invest in the US at this time?
Our outlook on the US is cautious at this point. In the short term, steep valuations, coupled with heightened uncertainty on the global macroeconomic front, can trigger some volatility.
However, investing in the US continues to offer Indian investors geographic diversification from the Indian market, access to global brands and secular growth sectors such as tech and discretionary consumption, and incremental return due to INR’s depreciation against the USD.
At this point, we recommend that investors invest in the US in a staggered manner, from a medium to long term perspective. We also recommend combining active and passive styles of investing in equal proportion. Active funds allow fund managers the flexibility to rotate sector and stock exposure when markets change, while passive products ensure low cost and steady compounding benefits offered by some of the world’s biggest names.
Krishna Karwa is the Senior Research Analyst of iFAST Financial. The views expressed in this article are solely of the author and do not necessarily reflect the views of Cafemutual.
