


Mutual funds are getting popular among investors. The latest data published in the red herring of HDFC AMC IPO issue shows that mutual funds are 21% of bank deposits as on December 2017.
In March 2013, mutual fund AUM accounted for 10.44% of bank deposits. This has risen to 17.44% in March 2017 and 21% in December 2017. While bank deposits grew by Rs.33.79 lakh crore, the mutual fund industry added Rs.14.25 lakh crore in four and a half years.
A Balasubramanian, CEO, Aditya Birla Sun Life AMC and AMFI Chairman makes the point that while mutual fund AUM to bank deposit stands at 18% in March 2017, in US, such a ratio was 100%. “There is an immense growth opportunity in India in terms of population dispersion and increasing per capita income from Rs.77,000 to Rs.2.40 lakh. The industry has tried to tap this investor base with various campaigns like ‘Mutual Fund Sahi Hai’ and “Jan Nivesh’. The mutual fund industry has seen over 20% CAGR growth in the last six years. If the industry maintains this pace, the mutual fund AUM will become Rs.94 lakh crore industry by 2025.”
Outstanding amount in bank deposits, mutual funds and life insurance
|
In Rs. lakh corore |
Mar-13 |
Mar-14 |
Mar-15 |
Mar-16 |
Mar-17 |
Dec-17 |
|
Bank deposits^ |
67.15 |
77.79 |
85.96 |
91.94 |
100.58 |
100.95 |
|
Savings account deposits |
17.58 |
20.13 |
22.36 |
25.52 |
32.45 |
35.80 |
|
Term deposits |
49.57 |
57.66 |
63.61 |
66.42 |
68.13 |
65.15 |
|
Mutual fund AUM |
7.01 |
8.25 |
10.83 |
12.33 |
17.55 |
21.27 |
|
Equity* |
1.89 |
2.08 |
3.72 |
4.26 |
6.28 |
9.39 |
|
Debt |
4.04 |
4.68 |
5.32 |
5.84 |
7.61 |
8.25 |
|
Liquid/Money Market |
0.93 |
1.33 |
1.63 |
1.99 |
3.14 |
2.86 |
|
Gold ETFs |
0.12 |
0.09 |
0.07 |
0.06 |
0.06 |
0.05 |
|
Other ETFs |
0.02 |
0.05 |
0.08 |
0.16 |
0.44 |
0.70 |
|
FOF Investing Overseas |
0.02 |
0.03 |
0.02 |
0.02 |
0.02 |
0.02 |
|
Mutual Funds as a %age of bank deposits |
10.44% |
10.61% |
12.60% |
13.41% |
17.44% |
21.07% |
|
Life insurance AUM |
17.45 |
19.58 |
22.48 |
25.02 |
28.54 |
33.21 |
Source: AMFI, RBI, Insurance Regulatory and Development Authority (“IRDAI”), CRISIL Research; ^ includes nationalised banks, private sector banks and foreign banks; * includes balanced funds
Another key macro-economic improvement in mutual funds is AUM to GDP ratio. At the turn of the century (fiscal year 2000), mutual fund investments accounted for just 5.6% of the GDP. Over the next 18 years, the industry gained wider acceptance amongst investors owing to better awareness, market rally and technological changes in the industry. In fiscal 2018, this value has risen to 12.8% of GDP. While this positive trend is a cause for cheer compared to global average, Indian MF industry still has a long way to go.
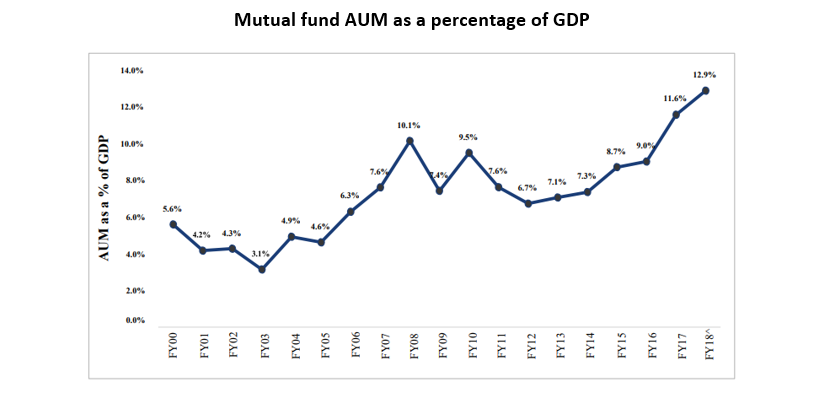
Source: AMFI, IMF, RBI, CRISIL Research; Note: Based on end of Fiscal AUM and GDP at current prices; GDP for Fiscal 2018 based on 2nd revised estimates
Further, the comparison of global data on penetration of mutual funds shows that developed countries such as US (101%), France (76%), Canada (65%) and UK (57%) have recorded highest mutual fund penetration. Even emerging economies like Brazil (59%) and South Africa (49%) have higher allocation to mutual funds compared to India. The world average of mutual fund penetration stands at 62%, which when compared to India’s allocation suggests a huge scope for growth.
Penetration of mutual funds in fiscal year 2017
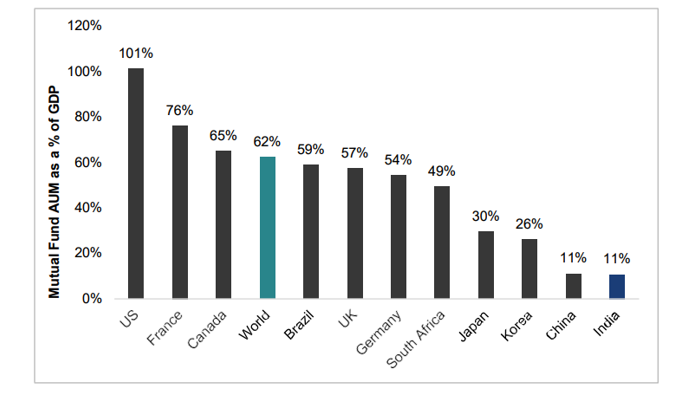
Source: IMF, The International Investment Funds Association (“IIFA”), CRISIL Research; Note: data as of December 2016; Fiscal 2017 GDP and AUM as of March 2017 used for India; only open-ended funds have been considered
Another indicator of low penetration is the equity mutual fund AUM to market cap ratio. While Germany has highest allocation of 51%, US follows closely with 42% allocation. In comparison, India has only 4% allocation. This low penetration indicates strong growth potential for the industry as a whole as well as equity mutual funds.
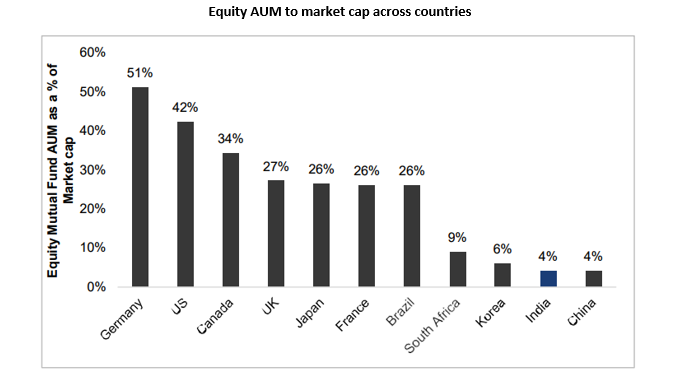
Source: IIFA, World Bank, London Stocks Exchange, Bank of England, CRISIL Research
Note: Data as of December 2016; only open-ended funds have been considered; balanced/mixed funds are assumed to be composed of 70% equity and 30% debt. Market cap for United Kingdom pertains to London Stock Exchange - Main Market

