


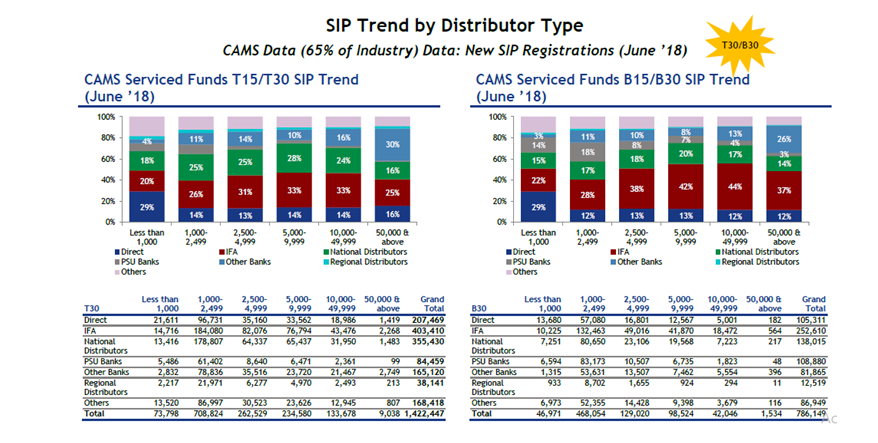
Of the total 22 lakh new SIPs created between April 2018 and June 2018, IFAs and NDs have activated close to 11.50 lakh folios or 51% of the overall new SIP addition, shows the latest CAMS data, which covers 65% of the industry.
While IFAs have created 6.56 lakh new SIPs in April-June 2018, national distributors activated 4.93 lakh SIPs in last quarter. Banks followed IFAs and NDs with 4.40 lakh SIPs with a major portion of it coming from private banks. Direct plan investors have created over 3 lakh SIPs in April-June 2018.
However, most of these SIPs amounted to less than Rs.2500. The data shows that majority of SIP accounts i.e. 11.77 lakh or 53% of the total SIP accounts reported investor commitment in the range Rs. 1,000 to Rs. 2,499. Similarly, 18% of SIP accounts or 3.92 lakh SIPs have come with the ticket size between Rs.2500 and Rs.4999. Close to 15% or 3.33 lakh SIPs have ticket size between Rs.5000 and Rs.9999.
In terms of geographical location, T30 and B30 locations reflect similar trends with majority of SIPs falling in Rs. 1,000 to Rs. 2,499 bracket followed by Rs. 2,500 to Rs. 4,999 bracket and Rs. 5,000 to Rs. 9,999 bracket.
Overall, the data shows that most investors tend to start SIPs in the range of Rs. 1,000 to Rs. 9,999. SIP investments in Rs. 50,000 and above bracket are particularly low with just 10,572 new SIP accounts.
IFAs have been top mobilisers of SIP accounts across different investment brackets ranging between Rs. 1,000 and Rs. 49,999. On the other hand, smaller SIPs that is SIPs below Rs. 1,000 have predominantly come through the direct route while banks have brought in SIPs above Rs.50,000.
Overall data combining T30 and B30 locations
|
Less than 1,000 |
1,000-2,499 |
2,500–4,999 |
5,000–9,999 |
10,000-49,999 |
50,000 & above |
Grand Total |
|
|
Direct |
35,291 |
1,53,811 |
51,961 |
46,129 |
23,987 |
1,601 |
3,12,780 |
|
IFA |
24,941 |
3,16,543 |
1,31,092 |
1,18,664 |
61,948 |
2,832 |
6,56,020 |
|
National Distributors |
20,667 |
2,59,457 |
87,443 |
85,005 |
39,173 |
1,700 |
4,93,445 |
|
PSU Banks |
12,080 |
1,44,575 |
19,147 |
13,206 |
4,184 |
147 |
1,93,339 |
|
Other Banks |
4,147 |
1,32,467 |
49,023 |
31,182 |
27,021 |
3,145 |
2,46,985 |
|
Regional Distributors |
3,150 |
30,673 |
7,932 |
5,894 |
2,787 |
224 |
50,660 |
|
Others |
20,493 |
1,39,352 |
44,951 |
33,024 |
16,624 |
923 |
2,55,367 |
|
Total |
1,20,769 |
11,76,878 |
3,91,549 |
3,33,104 |
1,75,724 |
10,572 |
22,08,596 |
|
%age of total SIPs mobilised |
5% |
53% |
18% |
15% |
8% |
0.5% |
100% |
Source: CAMS

