
Chhattisgarh’s equity assets jumped by a massive 29% in the last one-year ending December 2018, as per the latest AMFI data. Chhattisgarh, which ranks nineteenth in terms of the total industry AUM has 55% of its assets in equity schemes with Rs.7,400 crore of equity assets.
Assam, which ranks twentieth on the AMFI’s list, reflects a similar trend. The state added Rs. 1,286 crore of equity AUM during the year - an increase of 27%.
Better awareness about mutual funds in smaller towns seems to be bearing fruit as smaller states (Tripura 44% and Manipur 34%) and union territory (Andaman and Nicobar Islands 43%) have recorded fastest increase in their equity AUM. Though the increase in assets is not substantial in absolute terms, the growth indicates better acceptance of mutual funds across the country.
Other northeastern states like Sikkim, Mizoram and union territories like Dadra and Nagar Haveli are also seeing significant demand for equity funds.
In absolute terms, Maharashtra (Rs. 13,735 crore), Karnataka (Rs. 11,495 crore) and Uttar Pradesh (Rs. 9,707 crore) clinched the top three spots in terms of equity AUM.
Among all the regions, only Lakshadweep has seen a fall in its AUM.
Overall, the total equity AUM of the industry grew by 11% over the last one year.
State-wise equity AUM
|
S.no |
Name of the States/ Union Territories |
Equity Dec-2018 (Rs. crore) |
Equity Dec-2017 (Rs. crore) |
AUM growth (Rs. crore) |
Growth in equity |
|
1 |
Tripura |
562 |
389 |
173 |
44% |
|
2 |
Andaman and Nicobar Islands |
240 |
168 |
72 |
43% |
|
3 |
Manipur |
297 |
222 |
75 |
34% |
|
4 |
Himachal Pradesh |
2,555 |
1,962 |
593 |
30% |
|
5 |
Chhattisgarh |
7,388 |
5,737 |
1,651 |
29% |
|
6 |
Others |
43,973 |
34,585 |
9,389 |
27% |
|
7 |
Sikkim |
562 |
443 |
119 |
27% |
|
8 |
Assam |
6,099 |
4,813 |
1,286 |
27% |
|
9 |
Dadra and Nagar Haveli |
232 |
185 |
47 |
25% |
|
10 |
Mizoram |
98 |
80 |
18 |
23% |
|
11 |
Jharkhand |
13,456 |
11,146 |
2,310 |
21% |
|
12 |
Uttar Pradesh |
58,293 |
48,586 |
9,707 |
20% |
|
13 |
Uttarakhand |
5,189 |
4,326 |
862 |
20% |
|
14 |
Telangana |
17,466 |
14,644 |
2,822 |
19% |
|
15 |
Bihar |
12,277 |
10,329 |
1,948 |
19% |
|
16 |
Madhya Pradesh |
19,082 |
16,069 |
3,013 |
19% |
|
17 |
Karnataka |
76,960 |
65,465 |
11,495 |
18% |
|
18 |
Kerala |
16,373 |
13,968 |
2,405 |
17% |
|
19 |
Orissa |
11,423 |
9,776 |
1,647 |
17% |
|
20 |
Nagaland |
380 |
328 |
53 |
16% |
|
21 |
Arunachal Pradesh |
268 |
232 |
37 |
16% |
|
22 |
Punjab |
17,182 |
14,842 |
2,340 |
16% |
|
23 |
Haryana |
32,991 |
28,509 |
4,482 |
16% |
|
24 |
West Bengal |
65,348 |
56,582 |
8,765 |
15% |
|
25 |
Rajasthan |
21,232 |
18,550 |
2,681 |
14% |
|
26 |
Daman and Diu |
216 |
190 |
27 |
14% |
|
27 |
Pondicherry |
897 |
787 |
110 |
14% |
|
28 |
Jammu and Kashmir |
1,827 |
1,630 |
197 |
12% |
|
29 |
Gujarat |
84,309 |
75,975 |
8,334 |
11% |
|
30 |
Tamil Nadu |
51,533 |
46,496 |
5,036 |
11% |
|
31 |
Goa |
9,350 |
8,648 |
702 |
8% |
|
32 |
Andhra Pradesh |
19,947 |
18,885 |
1,062 |
6% |
|
33 |
Maharashtra |
3,15,700 |
3,01,964 |
13,735 |
5% |
|
34 |
Chandigarh |
4,730 |
4,537 |
193 |
4% |
|
35 |
Meghalaya |
873 |
846 |
27 |
3% |
|
36 |
New Delhi |
90,959 |
88,280 |
2,680 |
3% |
|
37 |
Lakshadweep |
5 |
5 |
-0 |
-2% |
|
Total |
1010271.23 |
910177.8 |
100093.43 |
11% |
Source: AMFI data
‘Others’ indicates assets from investors whose KYC is incomplete.
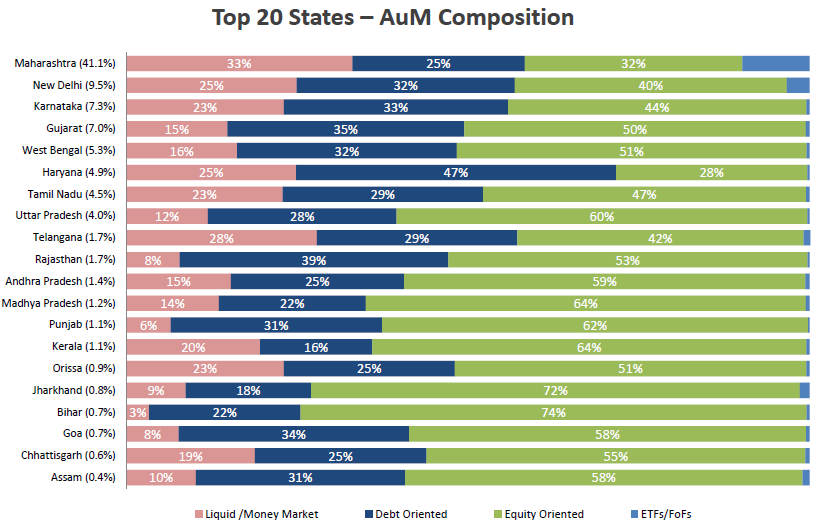
Total AUM
In line with previous trends, Maharashtra tops the country in terms of total AUM (41.1%) followed by New Delhi (9.5%) and Karnataka (7.3%), shows AMFI data.
Maharashtra (33% of its total AUM) also has the highest allocation to liquid funds among the top 20 states. This may be due to Maharashtra being a major investment hub with many companies and institutions having their corporate offices here.
Meanwhile, with 74% of Bihar’s AUM being invested in equities, it leads in terms of allocation to equity funds.
In majority of the states, the equity allocation is higher than the debt or liquid allocation. Though Haryana has 47% of its assets in debt funds, it a leader in terms of debt allocation among the states.