
Regular plans continue to dominate in equity mutual funds, shows a recent MFDEx report. In the first month of this financial year, regular plans contributed, Rs. 19,564 crore that is 76% of the gross equity flows of the industry.
MFDEx data covers 96% of industry. CAMS collates data from other R&T agents such as Karvy Computershare, Franklin Templeton and Sundaram BNP Paribas for the MFDEx report.
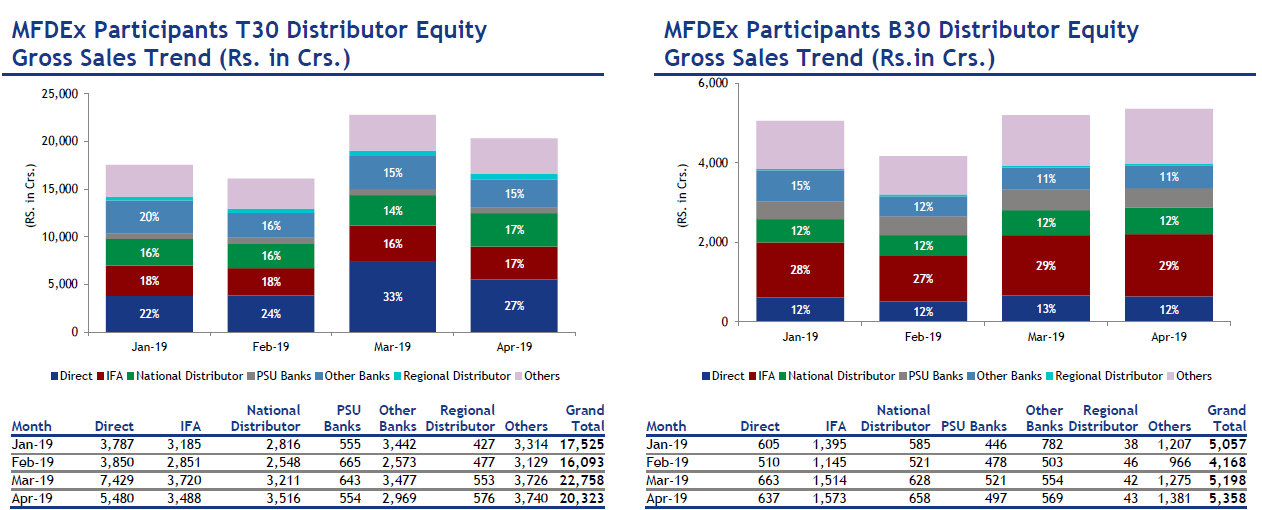
IFAs top the chart among the different distributor channels, bringing in Rs. 5,061 crore of gross equity investments from investors to mutual funds. However, IFAs contribution will increase further if we account for equity sales through national distributors (NDs). Many IFAs work with NDs like NJ, Prudent, under a sub-broking model. Overall, the combined equity sales of IFAs and NDs stood at Rs. 9,235 crore in April 2019. This is roughly 36% of the industry’s total flows.
Manish Mehta, National Head – Sales, Kotak Mahindra MF feels that as most IFAs are in the business for the long haul, they have adopted exemplary practises like recommending diversified equity funds and using risk mitigation tools like SIP and STP to help their clients create wealth. This in turn has helped them get more business over the long term.
Direct equity flows meanwhile, stood at Rs. 6,117 crore in April 2019. While these account for 24% of the industry inflows, Radhika Gupta, CEO, Edelweiss MF shared anecdotal evidence suggests that online distribution channels and RIAs have brought majority of these flows.
Akhil Chaturvedi, Associate Director, Head-Sales and Distribution, Motilal Oswal MF shared that currently, large family offices and institutional money, which typically comes through the direct route, are on a pause mode. The share of direct may increase if these start investing again.
Overall, in the first four months of CY 2019, the industry received inflows to the tune of Rs. 96,480 crore, of these Rs. 73,522 crore (76%) came through regular plans.
Equity gross sales
|
Month |
Direct |
IFA |
National Distributor |
PSU Banks |
Other Banks |
Regional Distributor |
Others |
Total |
|
Jan-19 |
4,392 |
4,580 |
3,401 |
1,001 |
4,224 |
465 |
4,521 |
22,582 |
|
Feb-19 |
4,360 |
3,996 |
3,069 |
1,143 |
3,076 |
523 |
4,095 |
20,261 |
|
Mar-19 |
8,092 |
5,234 |
3,839 |
1,164 |
4,031 |
595 |
5,001 |
27,956 |
|
Apr-19 |
6,117 |
5,061 |
4,174 |
1,051 |
3,538 |
619 |
5,121 |
25,681 |
|
Market share in April |
24% |
20% |
16% |
4% |
14% |
2% |
20% |
100% |
Source: CAMS