


B30 (beyond top 30 cities) assets grew by Rs. 6,000 crore in the first quarter of FY2019-20 to Rs. 3.97 lakh crore as on June, 30 2019, shows the latest AMFI data. T-30 assets meanwhile grew by Rs. 39,000 crore during the period.
Analysis of AMFI data for the month of June 2019 shows that unlike T30 assets, which have a more balanced distribution between individual and non-individual assets, majority of the B-30 AUM comes from individual investors. Close to 80% of the B30 AUM comes from individual investors in B30 cities compared to 56% in T30 cities.
Individual investors include retail and HNI investors. Non-individual investors include banks, corporates and other institutions.
The concentration of institutional investors in T30 locations leads to higher allocation from T30 cities to debt segment. Of the total T30 AUM, 62% is invested in non-equity (debt or hybrid) schemes while 38% is invested in equity schemes in June 2019. This ratio is reversed in B30 cities, which has higher contribution from individual investors. AMFI data for June shows that 65% of the B30 AUM is invested in equities while the rest is in debt or hybrid schemes.
AUM classification based on investor -type
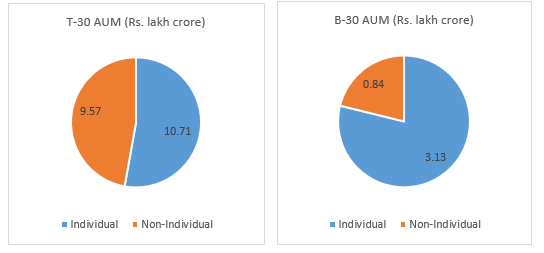
Source: AMFI, data as on June 30, 2019
Along with prominence of individual investors, B30 cities also record higher investments through the regular route. Around 77% of the B30 AUM is invested through regular plan in June 2019. Anecdotal evidence shows that typically, individual investors prefer to invest under the guidance of a financial advisor.
In contrast to individual investors, the institutional segment prefers direct plans. AMFI data shows that direct plans account for 44% of the AUM in T30 cities where institutional investors dominate.
AUM classification based on investment plan
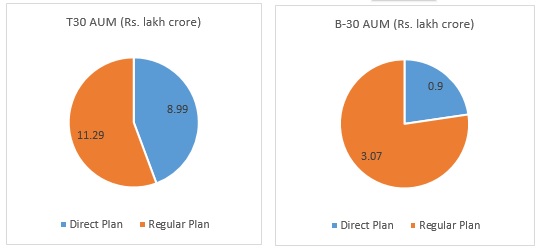 Source: AMFI, data as on June 30, 2019
While B30 AUM is just 16% of the total AUM, in terms of investor folios it accounts for 39% of the total industry folios. Both in T30 and B30 cities around 90% of the folios come from individual investors and only 10% were from institutional investors. D.P. Singh, ED & CMO (Domestic) SBI MF shares that lower income levels in B30 locations contribute to lower AUM vis-à-vis folios in these locations.
Folios
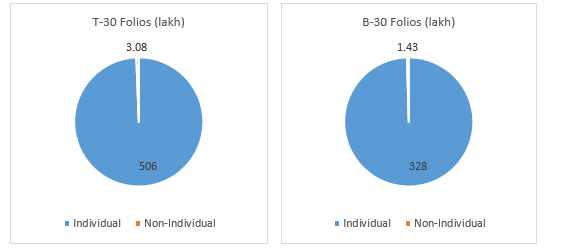 Source: AMFI, data as on June 30, 2019

