


With SEBI's Potential Risk Class (PRC) matrix rule coming into force from December 1, mutual funds have disclosed the risk level of each of their debt schemes.
The PRC matrix, which aims at enhancing transparency with respect to risks in debt schemes, can be an important tool for MFDs to identify the best suitable scheme for their clients.
The matrix comes with 9 cells as you can see below:
|
MaxCredit Risk of scheme→ |
Class A(CRV >=12) |
Class B (CRV >=10) |
Class C (CRV <10) |
|
Max Interest RateRisk of the scheme ↓ |
|||
|
Class I: (MD<=1 year) |
Relatively Low Interest Rate Risk and Relatively Low Credit Risk |
Relatively Low interest rate risk and moderate Credit Risk |
Relatively Low interest rate risk and Relatively High Credit Risk |
|
Class II: (MD<=3 years) |
Moderate interest rate risk and Relatively Low Credit Risk |
Moderate interest rate risk and moderate Credit Risk |
Moderate interest rate risk and Relatively High Credit Risk |
|
Class III: Any Macaulay duration |
Relatively High interest rate risk and Relatively Low Credit Risk |
Relatively High interest rate risk and moderate Credit Risk |
Relatively High interest rate risk and Relatively High Credit Risk |
On the Y-axis, different interest rate risk levels are mentioned (rising from top to bottom). Similarly, on the x-axis, credit risk levels are defined (rising from left to right).
The levels are decided based on two factors — Macaulay Duration (MD) for interest rate risk and Credit Risk Value (CRV) for credit risk. Here's what the two terms mean and how they are calculated.
Macaulay Duration: It is the time taken to recover the real cost of a bond measured in terms of years by calculating the present value of future cash flows (interest and principal). It generally applies to investments where returns are fixed.
At the scheme level, it is calculated as weighted average of the Macaulay Duration of each instrument.
Credit Risk Value (CRV): SEBI has given a numeric value to debt instruments based on the credit risk associated with them. The less the risk, higher is the credit risk value. For example, government securities have a CRV of 13, while below investment grade papers have a CRV of 1. AAA bonds, which are highest rated corporate bonds, have a CRV of 12.
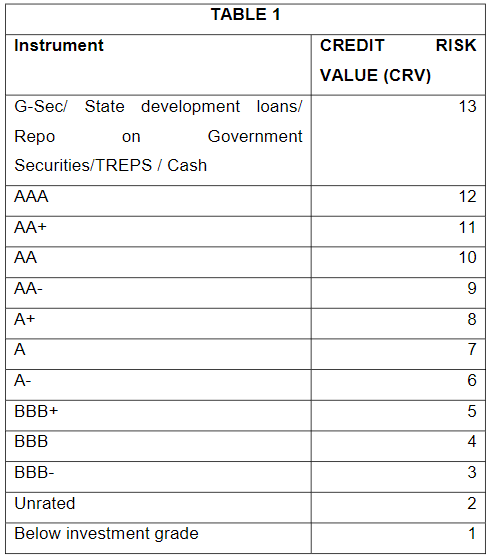
At the scheme level, it is calculated as weighted average of CRV of each instrument.
The way the matrix is designed, a fund can fall only in a select few categories. For example, liquid funds can fall only in the top three cells, as its Macaulay Duration cannot exceed the 1-year level, which is the class I criteria. So, the interest rate risk will always be comparatively low but the credit risk can vary.
Similarly, credit risk fund will generally occupy the bottom two slots in the third column of the table as their CRV is unlikely to touch 10.
Funds that may make it to each cell:
|
MaxCredit Risk of scheme→ |
Class A(CRV >=12) |
Class B (CRV >=10) |
Class C (CRV <10) |
|
Max Interest RateRisk of the scheme ↓ |
|||
|
Class I: (MD<=1 year) |
Liquid fund |
Liquid fund |
Liquid fund |
|
Class II: (MD<=3 years) |
Low duration fund |
Short duration fund |
Credit risk fund |
|
Class III: Any Macaulay duration |
Gilt fund |
Corporate bond fund Banking and PSU fund |
Credit risk fund |
One thing to note here is that the placement of a fund in a particular cell does not means it’s bound to take that level of risk. The idea behind the matrix is to define the maximum risk that a fund manager can take.
