


Listen to this article
The MF industry recently crossed the Rs 50 lakh crore landmark and reported a 25% annual growth in December 2023.
Let’s deep dive to understand contribution of retail and HNIs, B30/T30 assets and contribution of various distribution channel.
Investor categories and their share.
Of the Rs.51 lakh crore, Rs.31 lakh crore has come from individual investors – retail and HNIs. These investors now account for 60% of the total AUM. Their share increased from 58% in December 2022.
Overall, in December 2023, the slice in the AUM pie of corporate investors is the largest (38%), followed by HNI’s (34%) and retail investors (27%).
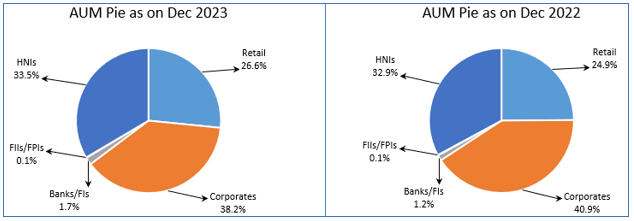
In absolute terms, HNI and retail assets reported a healthy growth of Rs 3.71 lakh crore and Rs 3.44 lakh crore, respectively. On the other hand, in pure percentage terms, the AUM of banks/FIs surged noticeably by 71% (owing to their modest base) and the retail AUM grew the second-highest i.e. by 34%. Let us look at this interesting table to know more.
|
Investor |
Dec-23 |
Dec-22 |
Change |
% Change |
||
|
₹ in crore |
% |
₹ in crore |
% |
|||
|
Retail |
13,58,350 |
27% |
10,14,712 |
25% |
3,43,638 |
34% |
|
Corporates |
19,49,357 |
38% |
16,65,836 |
41% |
2,83,521 |
17% |
|
Banks/FIs |
85,344 |
2% |
49,986 |
1% |
35,358 |
71% |
|
FIIs/FPIs |
4,098 |
0.1% |
4,572 |
0.1% |
-474 |
-10% |
|
HNIs |
17,11,924 |
34% |
13,41,065 |
33% |
3,70,859 |
28% |
|
Total |
51,09,072 |
100% |
40,76,170 |
100% |
10,32,901 |
25% |
Geographic contribution
Almost similar to the previous years, the individual share of B30 and T30 cities stood at 18% and 82%. However, the AUM went up by Rs 2.12 lakh crore (or 30%) in B30 cities and by Rs 8.21 lakh crore (or 24%) in T30 cities.
|
Geography |
Dec-23 |
Dec-22 |
Change |
% Change |
||
|
Rs in crore |
% |
Rs in crore |
% |
|||
|
B30 |
9,07,702 |
18% |
6,96,089 |
17% |
2,11,613 |
30% |
|
T30 |
42,01,369 |
82% |
33,80,081 |
83% |
8,21,288 |
24% |
|
Total |
51,09,072 |
100% |
40,76,170 |
100% |
10,32,901 |
25% |
Investment channel
Here the AUM is classified into three categories - direct, associate distributors and non-associate distributors. Associate distributors are affiliates of a fund house (for example SBI Bank in the case of SBI MF) and non-associate distributors include MFDs and NDs. These two collectively form regular AUM.
With a 48% share, MFDs and NDs take the lead, followed by direct plans (45%) and associate distributors (7%). To note, their share is similar to the previous year.
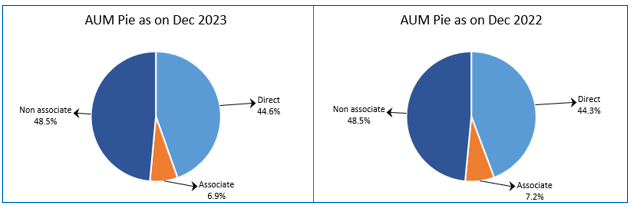
In terms of growth, the AUM of MFDs and NDs went up by Rs 5.03 lakh crore. Not far behind are direct plans where the assets grew by Rs 4.72 lakh crore. Interestingly, in percentage terms, the growth is 20% or more throughout categories.
|
Investment Channel |
Dec-23 |
Dec-22 |
Change |
% Change |
||
|
Rs in crore |
% |
Rs in crore |
% |
|||
|
Direct |
22,76,862 |
45% |
18,05,262 |
44% |
4,71,600 |
26% |
|
Associate |
3,53,242 |
7% |
2,95,299 |
7% |
57,944 |
20% |
|
Non associate |
24,78,967 |
49% |
19,75,610 |
48% |
5,03,357 |
25% |
|
Total |
51,09,072 |
100% |
40,76,170 |
100% |
10,32,901 |
25% |

